Client impact

Work that changed how leaders decide.

Representative engagements across consumer goods, financial services, energy, manufacturing and healthcare. Filter by industry or by business function. Client names and identifying details are withheld to protect confidentiality.

Industry

Function

Process

Representative view, recreated with illustrative data.

Consumer & retail · Operations & supply chain · Microsoft Fabric

A global consumer-goods company runs its supply chain end to end from one control tower

Seven end-to-end processes, from idea to launch through order to cash, ran on separate systems with their own KPI definitions. Service, cost and inventory were reviewed in different meetings, with numbers that did not reconcile.

The challenge

Forecast accuracy, on-time-in-full delivery, inventory days and cost to serve each came from a different team and a different source. Root causes surfaced weeks late; expedited freight and write-offs were discovered after the fact.

What we did

  • Defined one KPI language for plan, source, make and deliver: north-star outcomes, driver KPIs, owners and thresholds
  • Built a certified data model on Microsoft Fabric covering demand, supply, inventory, production, logistics, quality and financial impact
  • Delivered a control tower with exception triage across the seven processes: idea to launch, forecast to plan, source to pay, plan to produce, order to cash, deliver to serve and record to report
  • Set up the operating model: a business owner for every process, a weekly KPI quality review and closed-loop issue tracking

Impact

  • +8 pts forecast accuracy in pilot categories
  • −12% inventory days with no loss of service
  • +4 pts on-time-in-full delivery and 15% less premium freight
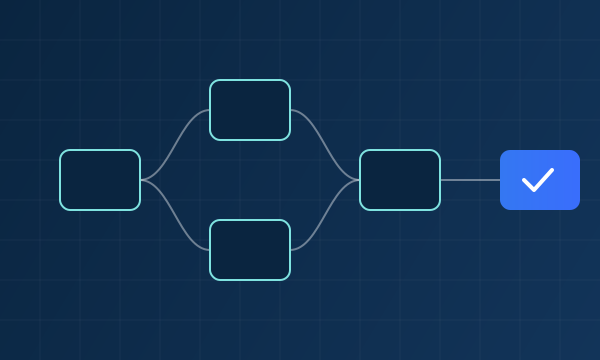
Representative view, recreated with illustrative data.

Consumer & retail · AI & automation · Power Platform

A global consumer-goods leader industrializes low-code and AI automation

Demand for digital solutions across logistics, manufacturing and sales far outpaced IT capacity. Leadership wanted to scale automation and adopt generative AI without creating ungoverned “shadow” tools.

The challenge

Critical processes ran on spreadsheets, email approvals and one-off tools. Each new request was built differently, with no common model for security, data access or support.

What we did

  • Defined the Power Platform environment strategy, security roles, data-access model and DLP policies
  • Built reusable patterns for apps, cloud flows and approvals, integrated through Azure Functions, Logic Apps and Data Factory
  • Introduced Copilot Studio agents, multi-agent orchestration and Model Context Protocol integrations into day-to-day workflows
  • Put analytics projects under Git version control with Azure DevOps CI/CD

Impact

  • 30+ digital solutions delivered per year
  • Governed environments with clear separation of duties
  • AI agents embedded in operational workflows, within existing security standards
Representative view, recreated with illustrative data.

Consumer & retail · Power BI · Lean Six Sigma

A global consumer-goods company builds a single view of sales, pricing and market share

In a fast-growing regional business, sales reporting was fragmented across channels, online prices drifted from policy, and new product registrations took too long to reach market.

The challenge

Commercial teams reconciled figures by hand before every review. Pricing exceptions surfaced late, and nobody owned an end-to-end view of the registration process.

What we did

  • Designed and delivered a Power BI sales management system as part of a digital transformation program
  • Built price-control analytics comparing online marketplace prices against policy
  • Delivered a category market-share dashboard with financial-efficiency analysis
  • Led a Lean Six Sigma project to map and streamline product registration

Impact

  • One trusted view of sales performance across channels
  • Price deviations visible by platform and product
  • Significantly shorter product-registration lead times
Representative view, recreated with illustrative data.

Consumer & retail · Order to cash · Power BI

A consumer-goods company sees the true cost to serve every customer, from order to cash

Trade deductions, freight and handling costs sat in different systems. Sales knew revenue by customer; nobody knew the margin left after the cost to serve.

The challenge

Deductions were cleared manually weeks after invoicing. Expedited freight and small-order surcharges were absorbed as overhead, so unprofitable service patterns stayed invisible.

What we did

  • Built an order-to-cash control tower: order fill, on-time delivery, invoice accuracy, open deductions and days sales outstanding on one page
  • Modeled cost to serve by customer, channel and lane, allocating freight, handling, deductions and returns to the order
  • Classified deductions with document AI and routed disputes to owners with service levels
  • Gave sales and finance the same customer profitability view, refreshed daily

Impact

  • 100% of customers with a visible cost to serve
  • −40% time to resolve deductions
  • −6 days sales outstanding
Representative view, recreated with illustrative data.

Consumer & retail · Finance · Marketing spend

A nutrition business gives its finance controller a decision view of marketing spend by brand

Marketing spend was reviewed in spreadsheets weeks after the month closed. Finance could see totals, not which brands were over plan while their sales fell behind.

The challenge

Spend sat in the ERP by cost center, plans in marketing’s files and sales in another system. Each review started by rebuilding the numbers, and over-spend was discovered after the budget was gone.

What we did

  • One model of marketing spend, plan and sales by brand, activity and month, refreshed daily from the ERP
  • A decision view for the finance controller and the business head: spend against plan next to sales against plan, by brand
  • Alerts when a brand’s spend runs ahead of plan while its sales trail
  • Monthly operational reviews run from the same view, with locked month-end numbers

Impact

  • Daily visibility of spend against plan, instead of weeks after close
  • 2 brands re-phased within the quarter, before the budget was exhausted
  • 1 review where finance and marketing debated actions, not numbers
Representative view, recreated with illustrative data.

Consumer & retail · Sales & marketing · Power BI

A CPG company moves sales incentives from what distributors buy to what they sell

Sales were measured on shipments to distributors. Quarter-end loading hid real demand, and the sales team had no view of the 8,000 restaurants and cafés their distributors served.

The challenge

Distributor sell-out data arrived in different formats and matched the company’s product and customer codes only partly. Leads, key accounts and distributor coverage were tracked in separate spreadsheets.

What we did

  • Matched distributor sell-out to the company’s products and customers, raising coverage from half of sales to most of it
  • A distributor Pareto and key-account view: who sells what, where, and where penetration is low
  • New-lead and opportunity tracking tied to the CRM, so sales results are recognized automatically
  • Sales incentives re-based on sell-out, with the same numbers visible to sales, finance and distributors

Impact

  • 86% of sales now visible at the point of sale
  • Quarter-end loading gone: shipments now track sell-out
  • Top 3 distributors make 67% of sell-out and have dedicated plans
Representative view, recreated with illustrative data.

Consumer & retail · Supply chain · Data & AI strategy

A global consumer health company designs an end-to-end supply chain control tower

Supply chain data sat in disconnected systems and each market calculated KPIs its own way. Review meetings were spent debating numbers instead of acting on them.

The challenge

Planners lacked early warning of demand shifts, inventory risk was hard to prioritize by business impact, and service failures were explained after the fact rather than prevented.

What we did

  • Designed a target BI architecture as a decision pipeline—from source data to a unified semantic layer to role-based cockpits and workflow actions
  • Built a capability model across Plan, Source, Make and Deliver, connected by a cross-functional control tower
  • Defined a KPI framework with north-star outcomes, driver metrics, owners, thresholds and review cadence
  • Prioritized demand sensing, inventory health and on-time-in-full use cases into a three-wave roadmap

Impact

  • One KPI language for supply chain, with a named owner for every metric
  • A sequenced roadmap from foundation to predictive, global rollout
  • Use cases that target stock-outs, overstock and service reliability together
Representative view, recreated with illustrative data.

Consumer & retail · Idea to launch · Lean Six Sigma

A consumer-goods business cuts new product set-up time from 55 days to 18

Fast-growing categories needed new products on shelf quickly, yet registering a new product code took 55 days on average, and anywhere from 11 to 155.

The challenge

Requests passed through six functions with no view of where they waited. Incomplete requests bounced back, urgent cases were handled by phone, and no one owned the end-to-end lead time.

What we did

  • Mapped the process and measured queue and touch time at every step from the workflow data
  • Simplified the request form and the approval sequence to one step per function
  • Introduced first-in, first-out rules and a real-time Power BI monitor of every open request
  • Set a service standard per step, with owners and a weekly review

Impact

  • 55 → 18 days average lead time
  • 144 → 21 days spread between the fastest and the slowest request
  • 9 in 10 new products set up within 30 days
Representative view, recreated with illustrative data.

Consumer & retail · Operations & supply chain · Finance

An infant nutrition business cuts market returns by managing distributor stock and performance

Returns of unsold product from distributors were one of the largest value-chain losses, and they were only visible when the credit notes arrived.

The challenge

Distributor stock, sell-out and return data lived with the planners, finance and sales separately. No one could see which distributors held too many weeks of stock before the product came back.

What we did

  • One view of distributor stock in weeks, sell-out, expiry exposure and returns, by distributor and product
  • A stock policy per distributor segment, with alerts when weeks of stock exceed the limit
  • Distributor performance re-evaluated monthly on sell-out and returns, not just on sell-in
  • Finance and supply planning review the same numbers before each order cycle

Impact

  • 4.1% → 2.3% of sales returned from the market
  • Under 6 weeks of stock at every major distributor
  • Monthly distributor review on sell-out, with returns owned by name
Representative view, recreated with illustrative data.

Consumer & retail · Logistics · Operations & supply chain

A consumer-goods company fills its trucks fuller and needs 14% fewer of them

Replenishment orders between plants and warehouses were turned into truckloads by hand. Loads left at 78% of capacity on average, and planners spent hours each day building them.

The challenge

Planners balanced product mix, pallet positions and weight limits in spreadsheets. Each market did it differently, and nobody could see how full the network’s trucks really were.

What we did

  • Load-building rules that optimize product mix against pallet, weight and volume limits for every lane
  • A load utilization cockpit: fill rate by lane, plant and carrier, with the loads below standard flagged daily
  • Optimized orders created automatically, with planners reviewing exceptions instead of building every load
  • Weekly review of lanes below target with logistics and planning

Impact

  • 78% → 91% average truck fill
  • −14% trucks needed for the same volume
  • Hours → minutes to build the day’s loads
Representative view, recreated with illustrative data.

Consumer & retail · Sales & marketing · Generative AI

A CPG company uses generative AI to write 3,200 recipe descriptions and the alt text for every image

Thousands of recipes on the brand sites had no description and most images had no alt text. Writing them by hand would have taken a content team more than a year.

The challenge

Descriptions had to fit each brand’s voice, be accurate to the recipe and pass review. Alt text was required for accessibility, and new recipes kept arriving every month.

What we did

  • A generation pipeline that reads recipe metadata, tags and images and drafts descriptions in each brand’s voice
  • Automated alt text for every image, checked against the recipe before publishing
  • Editorial review in the content system: approve, edit or reject, with every change fed back to improve the drafts
  • Production deployment that handles new recipes every month without manual work

Impact

  • 3,200 recipe descriptions written in six weeks
  • 100% of images with alt text
  • 9 in 10 drafts approved by editors without changes
Representative view, recreated with illustrative data.

Financial services · Finance · Microsoft Fabric

A North American financial institution brings management reporting onto one trusted platform

Management, finance and risk teams reported from different extracts, so the same question produced different answers—and every month-end consumed weeks of manual reconciliation.

The challenge

Performance by business line, product and region was assembled in spreadsheets. Adjustments were hard to trace, and access to sensitive financial data was managed report by report.

What we did

  • Brought balances, income, expenses and credit data together on a governed data platform
  • Defined one certified set of measures for revenue, margin, efficiency and credit losses
  • Automated reconciliation to the general ledger after every refresh
  • Built executive scorecards with variance to plan and prior year, and information security by business line

Impact

  • One reconciled set of numbers for management, finance and risk
  • A faster, more predictable month-end
  • Every adjustment traceable, with access governed by role
Representative view, recreated with illustrative data.

Financial services · Executive reporting · Report design

A financial institution redesigns its executive pack: from 127 visuals to the six pages leaders read

The monthly management pack had grown to 40 pages and 127 visuals. It took 90 seconds to open and most of a meeting to find the point.

The challenge

Every KPI had its own card and its own colours. Comparisons to plan and prior year looked different on each page, so meetings were about the charts, not the business.

What we did

  • One notation for actual, plan and prior year on every page, with signed variances and a message in every title
  • Replaced 107 KPI cards with a compact matrix and small multiples, and rebuilt the data model for speed
  • A design system: palette, typography, templates and a report checklist adopted by every team
  • Coached analysts to write the message first, then choose the chart

Impact

  • 40 → 6 pages and 90 → 4 seconds to open
  • One definition and one look for every KPI
  • Half the meeting time spent on what the numbers are
Representative view, recreated with illustrative data.

Energy & utilities · Oil and gas · Power BI

An oil and gas producer connects exploration, drilling and production data

Drilling reports, production volumes and capital spending lived in separate systems and spreadsheets. Engineers spent days compiling weekly reports, and cost overruns surfaced after the fact.

The challenge

Each asset team tracked wells, budgets and production its own way, so leadership could not compare performance across basins or see problems while there was still time to act.

What we did

  • Integrated drilling, production and capital-spend data on a governed data platform
  • Built well performance views that compare every new well with its expected production curve
  • Delivered capital spend against approved budgets, well by well, refreshed daily
  • Automated data validation, and field data capture with low-code apps

Impact

  • Weekly operations reporting produced automatically
  • Cost and schedule variances visible while wells are being drilled
  • One view of performance across assets and basins
Representative view, recreated with illustrative data.

Manufacturing & industrial · Operations · Power Platform

An industrial manufacturer standardizes plant performance across North America

Plants in three countries measured equipment effectiveness differently, and downtime reasons were captured on paper, if at all.

The challenge

Production, quality and maintenance data sat in separate systems at each site. Daily reviews debated the numbers instead of the causes, and improvement work could not be compared across plants.

What we did

  • Agreed one definition of equipment effectiveness and losses across all plants
  • Connected production, quality and maintenance data in Microsoft Fabric
  • Gave operators a simple app to record each stop and its cause at the line
  • Delivered plant and line scorecards, with automatic alerts for unplanned stops

Impact

  • One performance language from the line to the leadership team
  • Downtime captured at the source, by cause
  • Improvement priorities set on facts, plant by plant
Representative view, recreated with illustrative data.

Manufacturing & industrial · Finance · Microsoft Fabric

An industrial manufacturer replaces the annual budget cycle with a driver-based rolling forecast

Budgeting took four months and was out of date by the second quarter. Plant and sales assumptions lived in spreadsheets that finance re-keyed by hand.

The challenge

Volume, price, mix, material and labor assumptions were not linked, so leaders could not see why the forecast moved or test a scenario before deciding.

What we did

  • Built a driver-based model: volume, price and mix by product line, material and labor rates by plant, with actuals loaded from the ERP each month
  • Rolling 12-month forecast refreshed monthly, with locked snapshots so every version is auditable
  • Variance bridges from budget to forecast by driver, by plant and by product line
  • Scenario inputs in a Power Apps form, approvals in Teams

Impact

  • 4 months → 10 days forecast cycle
  • Half the forecast error at a three-month horizon
  • −60% finance time spent preparing data
Representative view, recreated with illustrative data.

Healthcare & life sciences · Finance · Data engineering

A healthcare provider network brings financial performance into one governed view

Revenue, collections and receivables data lived in separate exports and spreadsheets, and sensitive financial data had to be restricted to the right people.

The challenge

Leaders could not see where cash was stuck or which issues their teams could act on, and every department maintained its own version of the numbers.

What we did

  • Built governed Power BI semantic models on the enterprise lakehouse for revenue, collections and receivables
  • Codified business rules into the model, documented and owned by the business
  • Built information security into the model, with access governed and audited person by person
  • Automated refresh orchestration, timed to upstream warehouse loads

Impact

  • One view of financial performance, from executive scorecard to transaction
  • Zero line-level variance when detail was reconciled to source
  • Access governed user by user, with audit-ready coverage reporting
Representative view, recreated with illustrative data.

Healthcare & life sciences · Power BI · Security

A healthcare organization automates performance reporting and month-end close

Leadership wanted every clinician to see their own results—and only their own—while finance kept control of exports and month-end figures stopped moving after close.

The challenge

Names were spelled differently across systems, detailed reports were assembled by hand, and late adjustments could quietly change numbers that had already been reported.

What we did

  • Resolved identities across systems using stable identifiers instead of names
  • Delivered a personal scorecard with built-in information security, so each person sees only their own results
  • Built a separate finance export, restricted to approved users and gated by a monthly lock
  • Introduced locked month-end snapshots, refreshed automatically after close

Impact

  • Self-service access to individual performance detail
  • Locked, auditable month-end numbers—no silent restatements
  • Exports controlled by role, in line with finance policy
Representative view, recreated with illustrative data.

Healthcare & life sciences · HR & workforce · Power BI

A multi-site healthcare organization plans its workforce with headcount, attrition and compensation in one secure view

Headcount lived in the HR system, hours in time-keeping, pay in payroll and openings in recruiting. Leaders received a quarterly deck, three weeks after the quarter closed.

The challenge

Attrition was only visible after people had left. Compensation reviews compared roles by hand, and sensitive data could not be shared beyond HR.

What we did

  • One workforce model: headcount, hires, exits, vacancies, hours and compensation by site, role and tenure, refreshed weekly
  • Attrition analysis by tenure, role and manager, with early-warning indicators
  • Compensation positioning against bands, with information security so each leader sees only their own teams
  • Workforce plan against budget by month, with scenarios for openings and overtime

Impact

  • −5 pts first-year attrition
  • −18 days time to fill
  • Weekly view with role-based access replaces the quarterly deck
Representative view, recreated with illustrative data.

Healthcare & life sciences · Advanced analytics · Sales & marketing

A healthcare provider forecasts patient demand from first contact to completed treatment

Marketing spend, inquiries and clinical capacity were planned in separate spreadsheets, with no forward view of how today’s inquiries would become completed treatments.

The challenge

Leaders saw results only after the month closed. Budgets were set monthly while operations ran weekly, and channel performance could not be tied to outcomes.

What we did

  • Unified CRM, scheduling and operational data in the lakehouse and Power BI
  • Built cohort-based conversion curves from first contact to completed treatment
  • Delivered weekly forward-visibility reporting against budget, by market and channel
  • Converted monthly budgets into weekly targets using working-day calendars

Impact

  • A forward view of demand, weeks ahead
  • Budget pacing by market and channel in one place
  • Marketing channel performance tied to outcomes
Representative view, recreated with illustrative data.

Healthcare & life sciences · Sales & marketing · Power BI

A healthcare provider ties marketing spend to leads, visits and revenue by channel

Marketing reported clicks and leads; finance reported revenue. Nobody could say which channels filled the clinics six weeks later.

The challenge

Spend by channel, leads in the CRM, appointments in the practice system and revenue in finance were reconciled once a quarter, in a spreadsheet.

What we did

  • Joined spend, leads, consultations, scheduled and completed visits and revenue into one governed model, refreshed daily
  • Pacing views of spend and leads against the monthly budget and target, by channel and market
  • Cost per lead, cost per completed visit and return by channel, with a six-week lag between first contact and treatment
  • A weekly briefing for marketing and operations leaders, with exceptions first

Impact

  • Weekly return by channel instead of quarterly
  • −22% cost per completed visit after reallocating spend
  • ±3% budget pacing every month
Representative view, recreated with illustrative data.

Healthcare & life sciences · Quality analytics · Lean Six Sigma

A global medical technology manufacturer strengthens supplier quality management

Supplier performance was rated on a narrow set of indicators, and quality signals reached sourcing teams too late to prevent defects.

The challenge

Quality and sourcing teams worked from static reports, and drawing-release notifications to suppliers moved through manual channels that introduced errors.

What we did

  • Built control-chart trending, supply-management and supplier-quality dashboards
  • Identified and implemented new KPIs for the supplier performance rating system
  • Streamlined the drawing-release process by moving notifications into the supplier change-notification system

Impact

  • A broader, data-driven supplier rating system
  • Fewer defects in the drawing-release process
  • Timely supplier-quality visibility for sourcing and quality teams
Representative view, recreated with illustrative data.

Consumer & retail · Operations & supply chain · Sales & marketing · Power Apps

A consumer goods company tracks artwork and listing approvals in one queue

Launch dates slipped because artwork, legal and retailer listings waited in email. One request app with a live queue made every step and owner visible.

The challenge

Launches missed dates because approvals moved by email between marketing, regulatory, legal and sales, and nobody could see where a SKU was stuck.

What we did

  • One request form for every launch, with required fields and attachments
  • A live queue with owners, due dates and ageing by step
  • Automatic reminders and escalation when a step passes its service level
  • Launch status reporting for the monthly portfolio review

Impact

  • Approval cycle time visible by step and owner for the first time
  • Late launches traced to their cause instead of debated
  • A single list that marketing, regulatory and sales work from
Representative view, recreated with illustrative data.

Healthcare & life sciences · Operations & supply chain · Power BI

A medical technology company tracks regulatory and labelling readiness across launches

Submissions, labelling and device identification gate every launch. A readiness calendar shows the critical path for each product and the weeks at risk.

The challenge

Launch plans showed dates, not the regulatory and labelling steps behind them, so slips surfaced late and in different countries at different times.

What we did

  • A readiness model linking submissions, labelling and identification tasks to each launch
  • A calendar view of the critical path by product and market
  • Weekly exceptions for steps at risk, routed to regulatory and supply owners
  • Portfolio reporting for the launch council

Impact

  • Slips visible weeks earlier, with the step and owner named
  • One launch plan shared by regulatory, supply and commercial teams
  • Fewer last-minute market exceptions
Representative view, recreated with illustrative data.

Consumer & retail · Sales & marketing · Power BI

A consumer goods company reads the first 13 weeks of every launch the same way

Launch reviews compared different numbers from different teams. One launch scorecard reads sell-in, sell-out, distribution and repeat the same way for every product.

The challenge

Every launch review used a different definition of success, so decisions to support or withdraw a product came late and were argued.

What we did

  • A launch scorecard with sell-in, sell-out, distribution and repeat purchase by week since launch
  • Benchmarks from prior launches in the same category
  • Alerts when a launch falls below its benchmark corridor
  • A single review page for the monthly portfolio meeting

Impact

  • Support or withdraw decisions taken at week six, not week twenty
  • Launch plans calibrated on real prior performance
  • Marketing and sales reviewing the same page
Representative view, recreated with illustrative data.

Consumer & retail · Operations & supply chain · Sales & marketing · Machine learning

A consumer goods company lifts forecast accuracy with promotion-aware models

Most forecast error came from promotions the statistical model could not see. Models trained on the promotion calendar and sell-out cut error where it mattered.

The challenge

Forecast error spiked around promotions and seasonal peaks, and the planning team corrected by hand every week.

What we did

  • Demand models by SKU and channel trained on history, promotion calendar and sell-out
  • Accuracy and bias tracked by horizon and by category every month
  • Exception lists for the SKUs where the model and the planner disagree
  • A consensus workflow that records overrides and their reasons

Impact

  • Forecast error reduced most on promoted SKUs, where the money is
  • Planners spend their week on exceptions rather than on every line
  • Overrides measured, so the process improves
Representative view, recreated with illustrative data.

Manufacturing & industrial · Operations & supply chain · Finance · Power BI

A manufacturer runs sales and operations planning on one page

The monthly S&OP meeting worked from five decks. One page shows demand, supply, inventory and the financial view together, with the gaps to decide.

The challenge

Each function arrived at S&OP with its own deck and its own numbers; the meeting spent its time reconciling rather than deciding.

What we did

  • A single S&OP model combining demand plan, supply plan, inventory projection and financial outlook
  • One page per product family with the gaps and the decisions required
  • Scenario toggles for capacity, lead time and promotion changes
  • Decision log kept with the numbers each month

Impact

  • Meetings that decide instead of reconcile
  • Inventory projections and the financial view read together
  • A record of decisions and their outcomes
Representative view, recreated with illustrative data.

Consumer & retail · Operations & supply chain · Microsoft Fabric

A consumer health company plans capacity against a two-year demand outlook

Capacity decisions were made plant by plant. A network view of demand against capacity by line showed where constraints would bind and when.

The challenge

Investment requests arrived separately from each plant, with no shared view of where demand would exceed capacity across the network.

What we did

  • A demand outlook by product family and plant over 24 months
  • Capacity by line with planned maintenance and changeover assumptions
  • Utilization projections with the months where constraints bind
  • Scenario comparison for shifts, transfers and investments

Impact

  • Investments sequenced against the network, not negotiated plant by plant
  • Constraints visible a year ahead
  • One outlook shared by operations and finance
Representative view, recreated with illustrative data.

Consumer & retail · Operations & supply chain · Sales & marketing · Power BI

A retailer plans seasonal inventory from weekly point-of-sale data

Two months of the year made a third of sales. Weekly sell-through by store cluster replaced a national plan that was either short in November or heavy in January.

The challenge

The seasonal buy was planned nationally; some regions sold out early while others carried stock into clearance.

What we did

  • Weekly sell-through and stock cover by store cluster and category
  • A seasonal profile by region from three years of point-of-sale data
  • Replenishment and markdown triggers by week
  • A season review comparing plan, sell-through and clearance

Impact

  • Fewer stockouts in the peak weeks and less clearance after them
  • Regional buys instead of one national number
  • A season review that improves the next plan
Representative view, recreated with illustrative data.

Manufacturing & industrial · Operations & supply chain · Finance · Power BI

A manufacturer brings spend under contract with one spend cube

Purchasing could not say how much spend sat outside contracts. A spend cube by category, supplier and plant showed the maverick buying and the rebates left on the table.

The challenge

Spend data lived in several ERPs with inconsistent supplier names and categories; contract coverage was a guess.

What we did

  • Supplier and category harmonization across ERPs
  • A spend cube with contract coverage and payment terms by supplier
  • Rebate tracking against contract tiers
  • Monthly category reviews with the top opportunities

Impact

  • Spend under contract measured and rising quarter by quarter
  • Rebates earned against tiers made visible before year end
  • Category managers working from one list of opportunities
Representative view, recreated with illustrative data.

Consumer & retail · Finance · Operations & supply chain · Document AI

A consumer goods company automates invoice capture with document AI

Thousands of supplier invoices a month were keyed by hand. Document AI reads each invoice, checks it against the purchase order and routes only the doubtful ones to a person.

The challenge

Invoice processing depended on manual keying, with errors found at payment and suppliers calling about status.

What we did

  • Document AI extraction for invoices in several layouts and languages
  • Three-way match against purchase orders and receipts with validation rules
  • An exception queue with reasons, owners and ageing
  • Posting to the ERP with a full audit trail

Impact

  • Standard invoices processed without a touch
  • Exceptions handled in a queue, not in inboxes
  • Supplier status questions answered from the system
Representative view, recreated with illustrative data.

Healthcare & life sciences · Operations & supply chain · Power BI

A medical technology company scores suppliers on delivery, quality and terms

Supplier reviews were anecdotal. One scorecard reads on-time delivery, incoming quality, audit findings and payment terms the same way for every supplier.

The challenge

Supplier performance reviews relied on recollection and spreadsheets; the same supplier could be rated differently by two plants.

What we did

  • A supplier scorecard with on-time-in-full, incoming quality, audit findings and terms
  • Weighted scores agreed with purchasing and quality
  • Quarterly business review pages generated from the model
  • Corrective action tracking linked to the score

Impact

  • Supplier reviews based on the same evidence in every plant
  • Corrective actions tracked to closure
  • Terms and performance negotiated from one page
Representative view, recreated with illustrative data.

Manufacturing & industrial · Operations & supply chain · Microsoft Fabric

A manufacturer measures overall equipment effectiveness the same way on every line

Each plant calculated OEE differently, so comparisons were argued. One definition, one model and one scorecard made the losses comparable and the improvement visible.

The challenge

OEE numbers from different plants could not be compared, and losses were categorized inconsistently.

What we did

  • One OEE definition and loss taxonomy agreed across plants
  • Line-level data from machine systems and production orders in one model
  • A plant scorecard with availability, performance and quality losses
  • Weekly loss reviews with the top causes by line

Impact

  • Plants compared on the same basis for the first time
  • Improvement efforts aimed at the largest comparable losses
  • A scorecard the plant managers trust
Representative view, recreated with illustrative data.

Manufacturing & industrial · Operations & supply chain · Statistical process control

A plant cuts changeover variability with statistical process control

Changeovers at one plant ran 20% over standard with twice the spread of the others. Control charts by crew and product pair showed which changeovers to standardize first.

The challenge

Changeover time varied widely between crews and product pairs, and the schedule absorbed the variation as lost capacity.

What we did

  • Changeover times by line, crew and product pair from machine and order data
  • Control charts and distribution views that show spread, not just averages
  • Standard work targets and alerts for changeovers out of control
  • A monthly review of the pairs with the most capacity to recover

Impact

  • Variability identified by crew and pair, not blamed on the line
  • Capacity recovered without new equipment
  • A method the plant applies to the next loss
Representative view, recreated with illustrative data.

Consumer & retail · Operations & supply chain · Machine learning

A consumer goods company predicts line stoppages before they happen

Unplanned stops on filling lines cost shifts of output. Sensor and maintenance history trained models that flag the assets most likely to fail in the next two weeks.

The challenge

Maintenance was reactive; the same assets stopped repeatedly, and planned maintenance was scheduled by calendar rather than by condition.

What we did

  • Sensor, alarm and maintenance history combined by asset
  • Failure-risk models with explanations for each flagged asset
  • A weekly maintenance queue ranked by risk and production impact
  • Tracking of avoided stops against the plan

Impact

  • Maintenance planned by condition, not calendar
  • Fewer unplanned stops on the lines that matter most
  • Technicians starting the week from a ranked list
Representative view, recreated with illustrative data.

Consumer & retail · Finance · Sales & marketing · Power BI

A consumer goods company manages retailer deductions by root cause

Deductions were written off by exhaustion. Coding every deduction to a cause and an owner showed that a handful of causes explained most of the money.

The challenge

Retailer deductions arrived faster than finance could research them, and most were accepted after ageing out.

What we did

  • Deduction coding by cause, customer and owner
  • A Pareto of causes with the dollars behind each
  • Workflow routing to sales, logistics or pricing with service levels
  • Monthly recovery and prevention tracking

Impact

  • The few causes behind most of the deductions fixed at the source
  • Recoveries pursued while the evidence is fresh
  • Sales, logistics and finance working the same list
Representative view, recreated with illustrative data.

Consumer & retail · Finance · Sales & marketing · Microsoft Fabric

A consumer goods company settles customer rebates against the agreement, not the invoice

Rebate accruals and settlements lived in different systems and different hands. One model accrues as sales happen, settles against the contract and shows leakage by customer.

The challenge

Rebate agreements were applied inconsistently; accruals were adjusted at year end and disputes with customers lasted months.

What we did

  • Contract terms captured per customer: tiers, periods and eligible volumes
  • Accruals calculated from sales as they happen
  • Settlement reconciliation with the difference explained by customer
  • Leakage ranking and a review cadence with sales

Impact

  • Year-end surprises replaced by monthly visibility
  • Disputes resolved with the agreement and the data side by side
  • Leakage visible by customer and acted on
Representative view, recreated with illustrative data.

Healthcare & life sciences · Finance · Power BI

A healthcare network cuts claim denials with a work queue by payer and reason

Denials were worked oldest first. Grouping them by payer, reason and dollar value, with owners and deadlines, moved the money that could still be recovered.

The challenge

Claim denials were handled in order of arrival; appeal deadlines passed on recoverable claims while small ones consumed the team.

What we did

  • Denials grouped by payer, reason code and value
  • A work queue with appeal deadlines, owners and status
  • Root-cause reporting to registration, coding and clinical teams
  • Weekly recovery and prevention tracking

Impact

  • Appeals filed before deadlines on the claims that matter
  • Denial causes fed back to the teams that can prevent them
  • Recovery visible by payer every week
Representative view, recreated with illustrative data.

Consumer & retail · Finance · Power BI

A distributor-led business reduces days sales outstanding with collections prioritization

Collections called the largest balances. Ranking accounts by risk, ageing and dispute status, by region, brought cash in sooner without straining the relationships that mattered.

The challenge

Days sales outstanding drifted up as collections worked the largest balances regardless of risk, and disputes blocked payment of whole accounts.

What we did

  • Receivables ageing and dispute status by account and region
  • A collections priority score combining risk, ageing and value
  • Dispute resolution workflow linked to the account
  • Weekly DSO and cash forecast by region

Impact

  • Cash collected earlier from the accounts most likely to slip
  • Disputes cleared before they block payment
  • Regional teams working the same priorities
Representative view, recreated with illustrative data.

Consumer & retail · Operations & supply chain · Sales & marketing · Power BI

A consumer goods company redesigns delivery frequency by cost to serve

Small customers received the same delivery service as large ones. Cost to serve by customer tier showed where frequency, minimums and channel changes paid for themselves.

The challenge

Delivery frequency and order minimums were set by history, not by what each customer cost to serve.

What we did

  • Cost to serve by customer: picking, delivery, returns and service time
  • Customer tiers with service rules for frequency and minimums
  • Scenario modelling for frequency and channel changes
  • A quarterly review of tiers with sales

Impact

  • Service rules matched to what each tier is worth
  • Delivery cost per unit down on the long tail
  • Sales and logistics agreeing on service by tier
Representative view, recreated with illustrative data.

Healthcare & life sciences · Operations & supply chain · Dynamics 365

A medical technology company schedules field service with Dynamics 365 Field Service

Service calls were dispatched from spreadsheets and phone calls. Dynamics 365 Field Service with a schedule board and mobile app put work orders, parts and travel on one screen.

The challenge

Technicians received work orders by phone and email; parts availability and travel time were not visible at dispatch, and service levels were missed.

What we did

  • Dynamics 365 Field Service configured for work orders, contracts and parts
  • A schedule board with travel time, skills and service level
  • A mobile app for technicians with offline capture
  • Power BI reporting on service levels and first-time fix

Impact

  • First-time fix up as parts and skills are matched at dispatch
  • Service levels tracked per account and contract
  • Field data captured once, on the phone
Representative view, recreated with illustrative data.

Energy & utilities · Operations & supply chain · Power BI

A utility tracks service restoration and crew utilization across regions

Restoration reporting was assembled after each event. A live view of outages, crews and restoration times by region gave operations and communications the same picture during the event.

The challenge

During outages, operations, customer service and communications worked from different numbers, and crew utilization was reviewed weeks later.

What we did

  • Outage, crew and restoration data combined by region in near real time
  • Restoration time against standards and crew utilization by shift
  • A briefing page for incident command and communications
  • Post-event review with the timeline reconstructed from the data

Impact

  • One picture of the event for operations and communications
  • Crew deployment adjusted during the event, not after
  • Reviews based on the record, not recollection
Representative view, recreated with illustrative data.

Consumer & retail · Finance · Microsoft Fabric

A consumer goods company reconciles trade spend accruals to settlements every month

Trade accruals were trued up once a year, with a surprise. Monthly reconciliation of accruals to settlements by customer and event made the margin real every month.

The challenge

Trade spend accruals and settlements were reconciled annually, and the year-end adjustment was large enough to change the reported margin.

What we did

  • Trade events and agreements captured with their accrual rules
  • Monthly reconciliation of accruals to settlements by customer and event
  • Variance explanations owned by sales finance
  • A close calendar with the trade reconciliation as a gated step

Impact

  • Margin reported monthly on the same basis as year end
  • Year-end adjustments reduced to small, explained items
  • Sales and finance agreeing on one trade number
Representative view, recreated with illustrative data.

Manufacturing & industrial · Finance · Operations & supply chain · Power BI

A manufacturer explains standard cost variances to the driver, every month

Variance reports listed amounts without reasons. Decomposing variances into price, usage, volume and mix by plant turned the month-end pack into a conversation about causes.

The challenge

Standard cost variances were reported as totals per plant; the causes were investigated by hand after the pack was published.

What we did

  • Variance decomposition into price, usage, volume and mix by plant and product family
  • Driver trends by plant with alerts on unusual months
  • Commentary captured next to each variance by the plant controller
  • A monthly pack that opens on the three largest drivers

Impact

  • Causes known when the pack is published, not weeks later
  • Plant controllers explaining their own numbers
  • Fewer recurring variances as the causes are fixed
Representative view, recreated with illustrative data.

Financial services · Finance · Microsoft Fabric

A financial institution locks month-end snapshots so the board sees one set of numbers

Figures quoted to the board changed between meetings as data was restated. Locked monthly snapshots with lineage back to source made every number reproducible a year later.

The challenge

Restatements and late postings changed historical figures, and the board asked why last quarter's numbers had moved.

What we did

  • Locked month-end snapshots in the semantic model, with a controlled restatement process
  • Lineage from every published figure back to the ledger
  • A board pack generated from the snapshots, in both languages
  • An audit view of who changed what, and when

Impact

  • Numbers quoted to the board stay the same a year later
  • Restatements visible and explained rather than silent
  • Audit questions answered from the system in minutes
Representative view, recreated with illustrative data.

Consumer & retail · Sales & marketing · Finance · Power Automate

A consumer goods company automates distributor claims and incentive payments

Distributor claims for promotions and incentives arrived as spreadsheets and were checked by hand. Automated validation against sell-out and the agreement paid the right claims faster and flagged the rest.

The challenge

Claims took weeks to validate, distributors chased payments, and the same claim was sometimes paid twice.

What we did

  • Claim intake through a portal with the required evidence
  • Automated validation against sell-out data and the incentive agreement
  • Duplicate and tolerance checks with an exception queue
  • Payment file generation and a status view for distributors

Impact

  • Valid claims paid within the agreed days
  • Duplicates and out-of-policy claims stopped before payment
  • Distributors checking status themselves
Capability showcase, built with illustrative data.

Education · Capability showcase

What enrolment and capacity planning looks like for a school board

An illustration of how we help boards see enrolment, capacity and funding together, by school family and grade cohort. It shows our approach; it is not a client engagement.

The question leaders ask

Where will enrolment fall or grow over the next five years, which schools will be over or under capacity, and what does each scenario mean for funding and staffing?

What we would build

  • Projections by school and grade cohort from registrations, housing approvals and historical yields, refreshed monthly
  • Capacity and utilization by school family, with boundary and program scenarios
  • The funding effect of each scenario, so trustees see dollars next to students
  • Reports in English and French that meet accessibility standards

What it enables

  • Earlier, evidence-based decisions on boundaries, additions and staffing
  • One projection shared by planning, finance and trustees
  • Fewer surprises when provincial funding follows actual enrolment
Capability showcase, built with illustrative data.

Education · Assessment and evaluation · Capability showcase

What assessment analytics look like when they follow the student, not the snapshot

An illustration of how a board can read provincial and classroom assessment results by school, strand and cohort, with privacy built in. It shows our approach; it is not a client engagement.

The question leaders ask

Which schools and which strands moved, for the same students over time, and where should instructional support go next year?

What we would build

  • Results by school, grade and strand against the board and the province, with small counts suppressed
  • Cohort tracking: the same students from one assessment to the next, so growth is visible, not just pass rates
  • Links to interventions and programs, to see what is associated with growth
  • Aggregated, role-based views for principals, superintendents and trustees

What it enables

  • Instructional support directed to the schools and strands where it changes outcomes
  • A shared evidence base for the student achievement plan
  • Student privacy protected by design
Capability showcase, built with illustrative data.

Education · Colleges and universities · Capability showcase

What an early-alert view looks like for a college or university

An illustration of how an institution can see which students are at risk in the first six weeks, reach them, and measure whether they persist. It shows our approach; it is not a client engagement.

The question leaders ask

Which students are drifting in the first weeks of term, has someone reached them, and does the follow-up change who comes back next year?

What we would build

  • Early signals from the learning platform, attendance and early grades, combined by course and program
  • A daily view for advisors: who to contact, by when, and what has already been done
  • Persistence to the next term and year by group, so the program is judged on outcomes
  • Consent, privacy and access by role designed in from the start

What it enables

  • Students contacted in days rather than discovered at the end of term
  • Advising capacity focused where it changes persistence
  • A retention program measured by evidence, not anecdotes
Capability showcase, built with illustrative data.

Public sector & defence · Capability showcase

What a service-delivery briefing for a government department looks like

An illustration of how we help public sector leaders see service standards, backlog and spending in one secure, bilingual and accessible view. It shows our approach; it is not a client engagement.

The question leaders ask

Which programs are missing their service standards, why, and where would added capacity make the biggest difference for citizens?

What we would build

  • One governed view of intake, output, backlog and processing time for every program
  • Service standards and spending tracked against targets and plans every month
  • Reports in English and French that meet accessibility standards
  • Information security and audit trails suited to government data

What it enables

  • Earlier action on programs at risk of missing their standards
  • Capacity decisions based on evidence, program by program
  • Transparent reporting to executives and oversight bodies

Representative work delivered by MJ Insight consultants. Client names and identifying details are withheld to protect confidentiality. The public sector and education examples are capability showcases built with illustrative data, not client engagements.

Start a conversation

Let’s talk about your data and AI agenda.

Tell us where you are today and what you need to decide next. A senior consultant will respond within one business day.

Contact us